Increase QuickBooks Information Output
0Sometimes you need to look at your QuickBooks data in ways that aren’t on the standard reports in QuickBooks, but not often enough to require purchasing a third-party reporting tool. This can be accomplished by exporting detailed information to Excel and then using Pivot tables to put the information into useful tables of summarized information.
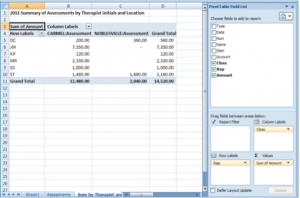
When you insert a pivot table, it asks you to define the range of data to use as a basis (including the headings)  and then displays a field list for you to select where to “drag & drop” the fields (as a filter, column label, row label, and sum value). The filter is used if you want to select a different value for the entire table (i.e., if I only wanted to look at one location).For example, one of my clients owns a private counseling center and one of their services is doing assessments. They wanted to know how many assessments were done by each of their staff over a period of time. In QuickBooks, they use the REP field on the invoice for the initials of the staff member. I created a custom Transaction Detail report in QuickBooks selecting the Invoice transaction type, Date, Client name, Class, Rep and Amount build the detail report for the pivot table. I then exported it to Excel. In Excel, I selected Insert > Pivot table and it will ask you to verify the range of the data you want to report from, then I selected my fields from the Pivot Table Field List by dragging & dropping them where I wanted to see the information and the display is immediate.
The Class field for Assessments was placed in the column labels section (there are two locations that do assessments, so each goes into a separate column)
The Rep field was placed into the Row labels section
The Amount field was placed into the Sum Values section. Depending on the field you place in the Sum Values section, it may default to Count instead of Sum. To change it, just click on the arrow next to “Count of xxx” and select Value Field Settings and select a different calculation type (sum, average, max, min, etc.).
It’s that easy to wow your client with different ways to look at their data. And the best part is you can update the Excel spreadsheet with new QuickBooks data directly in Excel.

Comments